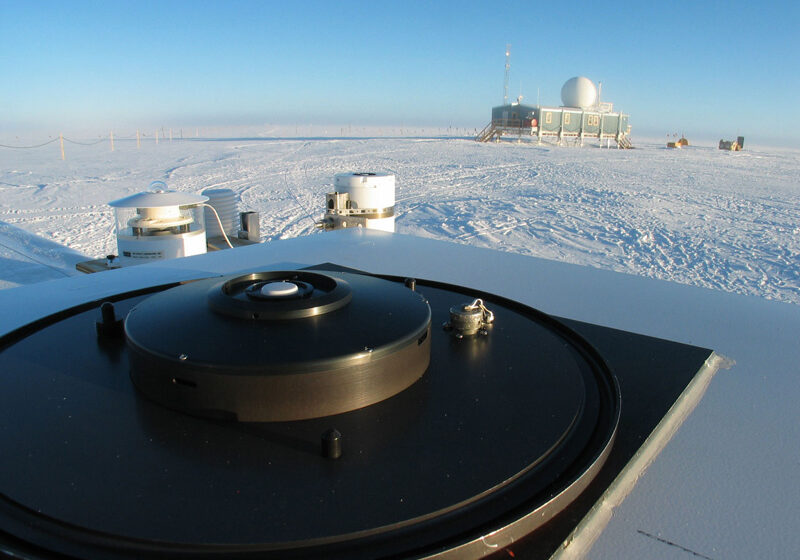
In 1987, responding to serious ozone depletion reported in Antarctica, the Division of Polar Programs of the National Science Foundation called for the establishment of an ultraviolet (UV) monitoring system in Antarctica. Biospherical Instruments was selected to install a network of instruments, which became known as the NSF Office of Polar Programs Ultraviolet Spectral Irradiance Monitoring Network (UVSIMN). When the network was fully established, locations included the South Pole; two research stations at the Antarctic coast (McMurdo and Palmer); the city of Ushuaia at the tip of South America; the Arctic village of Barrow (now Utqiagvik); and Summit, a research camp established at the top of Greenland’s ice sheet (Figure 1). An additional instrument is located to this day at our company’s headquarters in San Diego.
Biospherical Instruments was responsible for overseeing the network's operation, data processing, quality control, and dissemination of data between its inception in 1988 and 2009. The three instruments located in Antarctica were transferred to NOAA in 2009 and are now part of NOAA's Antarctic UV Monitoring Network. However, Biospherical Instruments remains responsible to this day for producing the final data of NOAA's network. The combined datasets of the NSF and NOAA networks make up one of the longest Climate Data Records of UV radiation in existence. Measurements at Ushuaia (Argentina), Barrow (Alaska), and Summit (Greenland) were discontinued in 2008, 2016, and 2017, respectively.
Data of the former NSF and the current NOAA networks are distributed via the website, which also provides extensive information on the network's instrumentation, data processing, quality control, and data format.
In addition to making UV observations, BSI has added a strong research component to the project with a focus on atmospheric physics. Results have been presented at numerous conferences and were published in more than 100 papers, either independently or in collaboration with other researchers. Some of these results are summarized here.
Climatology of UV radiation
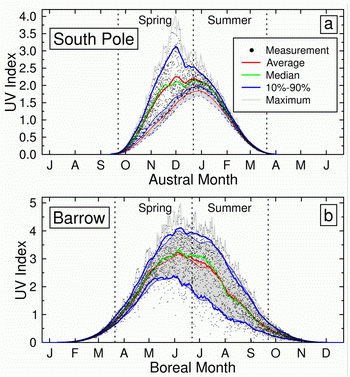
We established a climatology of the UV Index (a measure of sun-burning radiation) for all sites of the NSF UV Monitoring Network. Results were published by Bernhard et al. (2010) and examples of these results for the South Pole and Barrow are shown in Figure 2.
Measurements of the noontime UV Index covering all years of network operation are indicated by black dots. Associated statistics (average, median, 10th and 90th percentile, overall maximum) are drawn with thick lines. At the South Pole, there is a strong enhancement during the spring (October to November) because of the effect of the ozone hole. At Barrow, average UV Indices are more symmetrical about the summer solstice (broken vertical line), but the variability is much larger in summer than spring. This is a consequence of the annual cycles of snow cover, sea ice extent, and cloudiness.
We also compared UV indices at the South Pole (representative for the polar plateau) and Summit (representative for Greenland’s interior) (Bernhard et al. 2008a). One important result was that the UV indices measured during the austral spring at the South Pole are 1.9–2.4 times larger than the UV indices during the vernal spring at Summit despite the similar locations of the two sites on vast, highly reflective, and high-altitude ice sheets.
Measured values from the South Pole and Barrow were also compared with estimates of historical UV Indices (1963–1980 for the South Pole; 1973–1980 for Barrow), which were reconstructed from data of total ozone predating operations of the network. These estimates are indicated in Figure 2 by gray-shading. During October and November, the average UV Index measured at the South Pole between 1991 and 2006 was 55–85% larger than the estimate for the years 1963–1980. In contrast at Barrow, there was little change between the two periods: the gray-shaded area in Figure 2 has a similar pattern to that of recent measurements. The analysis provided valuable insight into the evolution of UV irradiance during the last 30 years.


Factors affecting UV radiation
UV irradiance at the surface is affected by the solar elevation, total ozone, clouds, Rayleigh scattering, surface albedo (e.g., snow cover and sea ice extent), aerosols, absorption by trace gases, and Sun–Earth distance. In 2007, we published a study that separated the effect of these factors (Bernhard et al. 2007). The analysis was based on our UV measurements at Barrow.
Figure 3 summarizes some of the results. Panel a indicates the effect of the total ozone column on the annual cycle of the UV Index at Barrow. Data are normalized to the effect of ozone at the summer solstice. Data for individual years are indicated by small dots, and large red circles represent the climatology. Because of larger atmospheric ozone concentration in April, the UV Index is about 25% lower compared to the solstice, while lower ozone in September enhances the UV Index by about 20%.
High albedo in spring, due to snow and sea ice cover, increases the UV Index by 40–55% compared to summer when albedo is very low (Panel b). The albedo in May and June was greatly affected by the date of snow melt and ranged between 0.2 and 0.8. Aided by sunphotometer measurements provided by NOAA, we showed that aerosols reduce the UV Index by typically 3–5%.
Aerosol effects are largest during the spring because of “Arctic haze” episodes (Panel c). The effect of clouds is much larger during the summer and fall, partly because of the increased frequency of storms (Panel d). In addition, the effect of clouds is moderated during the spring because of multiple reflections between snow-covered ground and the cloud ceiling.
In Panel e, the effects of the four factors are drawn on a common scale. The spring-time reduction of the UV Index due to the annual ozone cycle is overcompensated by the effects of albedo and clouds, highlighting that measurements of ozone alone are not sufficient for understanding the Arctic UV climate.
Our study suggested that long-term changes of albedo and clouds may have a profound effect on the Arctic UV climate. The importance of clouds is further highlighted in Panel f, indicating that the year-to-year variability in UV due to clouds, exceeds that of the other factors, particularly during summer and fall.
Validation of Total Ozone Measurements
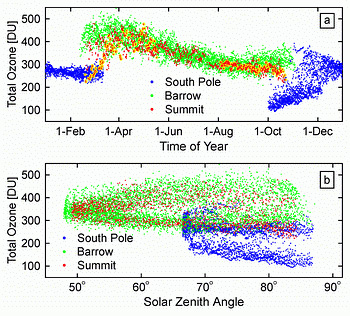
We developed a new method for calculating total ozone from global irradiance spectra measured by instruments of the NSF UV Monitoring Network (Bernhard et al. 2003). The method takes vertical profiles of ozone and temperature into account and delivers more accurate results at small solar elevations than previous approaches (Figure 3).
Measurements of the UV network have also been used for the validation of total ozone observations performed by the instruments usually used for this purpose (Dobson and Brewer spectrophotometers). As part of this research, we discovered an error in the Dobson ozone absorption coefficients recommended by the World Meteorological Organisation (Bernhard et al. 2007a). Our results may help to improve the accuracy of measurements performed by WMO’s Global Atmospheric Watch program.
Our data have also been used for the validation of surface UVR retrievals of the Ozone Monitoring Instrument (OMI) on NASA’s AURA satellite (Tanskanen et al. 2007b). One important result was that OMI underestimates erythemal UV doses at coastal high-latitude locations sometimes by up to 60%.
Intercomparison campaigns
The quality of data of the UV Monitoring Network has been regularly assessed by participation in intercomparisons. The SUV-150B spectroradiometer now installed at Summit participated in the fifth North American Interagency Intercomparison for UV Spectroradiometers, held at Boulder, Colo., in 2003 (Wuttke et al. 2006, and Lantz et al. 2008). The instrument at McMurdo was compared with a NIWA spectroradiometer, which was brought to Antarctica for a 2-month campaign (Bernhard et al. 2008b). The quality of the network’s UV data meets the standard of the Network for the Detection of Atmospheric Composition Change (NDACC), a global network focusing on high-quality long-term measurements of atmospheric constituents.
Development of quality control tools
We developed an extensive set of software tools for the quality control of spectral measurements, which includes the test and correction of measured spectra for wavelength shifts, the cosine error, outliers, responsivity drifts, detection limits, etc. (Bernhard et al. 2004). We also developed methods utilizing measurements of filter radiometers for the quality control of spectroradiometric data (Bernhard et al. 2005 and 2008a). These tools continue to be routinely implemented for preparing and testing data of the NOAA's Antarctic UV Monitoring Network.
References
Bernhard, G., C.R. Booth, and R.D. McPeters. (2003). Calculation of total column ozone from global UV spectra at high latitudes. J. Geophys. Res., 108(D17), 4532, doi:10.1029/2003JD003450.
Bernhard, G., C.R. Booth, and J.C. Ehramjian. (2004). Version 2 data of the National Science Foundation’s Ultraviolet Radiation Monitoring Network: South Pole, J. Geophys. Res., 109, D21207, doi:10.1029/2004JD004937.
Bernhard, G., R.D. Evans, G.J. Labow, and S.J. Oltmans. (2005a). Bias in Dobson Total Ozone Measurements at High Latitudes due to Approximations in Calculations of Ozone Absorption Coefficients and Airmass. J. Geophys. Res., 110, D10305, doi:10.1029/2004JD005559.
Bernhard, G., C.R. Booth, and J.C. Ehramjian. (2005b). Real-time ultraviolet and column ozone from multichannel ultraviolet radiometers deployed in the National Science Foundation’s ultraviolet monitoring network. Opt. Eng., 44(4), 041011-1 – 041011-12.
Wuttke S., G. Seckmeyer, G. Bernhard, J. Ehramjian, R. McKenzie, P. Johnston, and M. O'Neil. (2006). New spectroradiometers complying with the NDSC standards, J. Atmos. Ocean. Tech., 23(2), 241–251.
Bernhard, G., C.R. Booth, J.C. Ehramjian, R. Stone, and E.G. Dutton (2007a). Ultraviolet and visible radiation at Barrow, Alaska: Climatology and influencing factors on the basis of version 2 National Science Foundation network data, J. Geophys. Res., 112, D09101, doi:10.1029/2006JD007865.
Bernhard, G., C.R. Booth, and J.C. Ehramjian. (2008a). Comparison of UV irradiance measurements at Summit, Greenland; Barrow, Alaska; and South Pole, Antarctica, Atmos. Chem. Phys., 8, 4799–4810.
Bernhard, G., R.L. McKenzie, M. Kotkamp, S. Wood, C.R. Booth, J.C. Ehramjian, P. Johnston, and S.E. Nichol. (2008b). Comparison of ultraviolet spectroradiometers in Antarctica, J. Geophys. Res, 113, D14310, doi:10.1029/2007JD009489.
Bernhard, G., C.R. Booth, and J.C. Ehramjian. (2010). Climatology of Ultraviolet Radiation at High Latitudes Derived from Measurements of the National Science Foundation’s Ultraviolet Spectral Irradiance Monitoring Network. In: UV Radiation in Global Climate Change: Measurements, Modeling and Effects on Ecosystems, edited by W. Gao, D.L. Schmoldt, and J.R. Slusser, 544 pp., Tsinghua University Press, Beijing and Springer, New York, ISBN 978-3-642-03312-4. https://link.springer.com/book/10.1007/978-3-642-03313-1
Lantz, K., P. Disterhoft, J. Slusser, W. Gao, J. Berndt, G. Bernhard, S. Bloms, R. Booth, J. Ehramjian, L. Harrison, G. Janson, P. Johnston, P. Kiedron, R. McKenzie, M. Kimlin, J.P. Neale, M. O’Neill, V.V. Quang, G. Seckmeyer, T. Taylor, S. Wuttke, and J. Michalsky. (2008b). The 2003 North American interagency intercomparison of ultraviolet spectroradiometers: Scanning and spectrograph instruments, J. Appl. Remote Sens., 2, 023547, doi:10.1117/1.3040299.
Tanskanen, A., A, Lindfors, A. Määttä, N. Krotkov, J. Herman, J. Kaurola, T. Koskela, K. Lakkala, V. Fioletov, G. Bernhard, R. McKenzie, Y. Kondo, M. O’Neill, H. Slaper, P. den Outer, A.F. Bais, and J. Tamminen. (2007b). Validation of daily erythemal doses from Ozone Monitoring Instrument with ground-based UV measurement data, J. Geophys. Res., 112, D24S44, doi:10.1029/2007JD008830.
![factors affecting UV <b>Figure 3.</b> Effect of total ozone (a), albedo (b), aerosols (c), clouds (d) on the annual cycle of the UV Index at Barrow. Panel (e) compares the effects of all factors on a common scale and panel (f) quantifies the variability of the various factors. Figure is from Bernhard et al., [2007].](https://www.biospherical.com/wp-content/uploads/2024/03/factorsaffectinguv_barrow_350.jpg)

